Assignment 1
by
Allison McNeece
Exercise: Examine graphs of y = a sin (bx + c) for different values of a, b, and c.
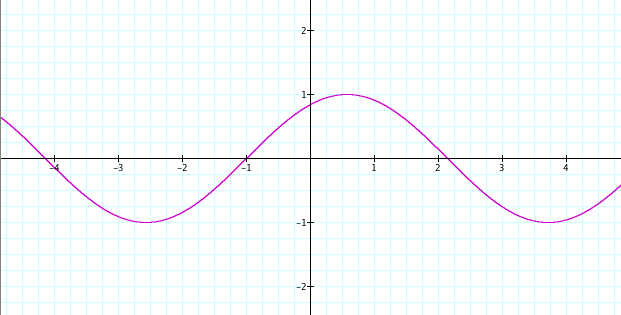
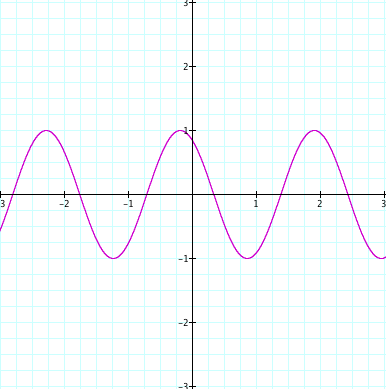
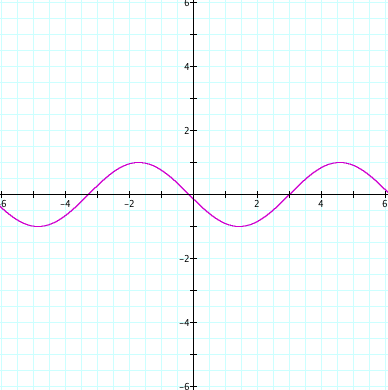
Lets begin with the simple case of a, b, c = 1
playing around with the values of a,b,c will give us a visual of how they change the graph:
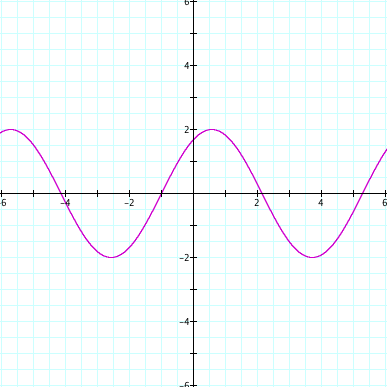
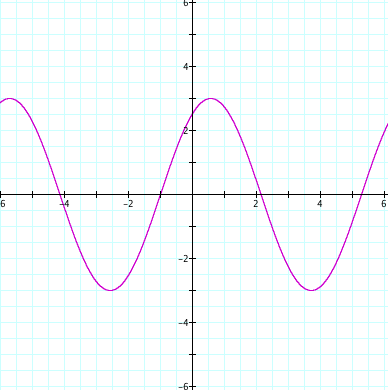
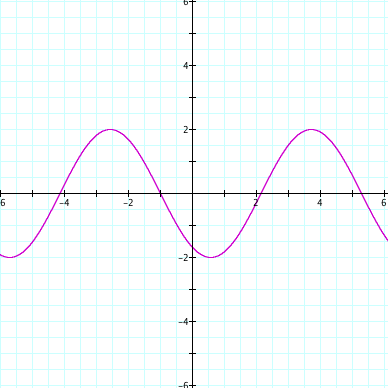
Let us first vary a but keep b and c fixed at 1:
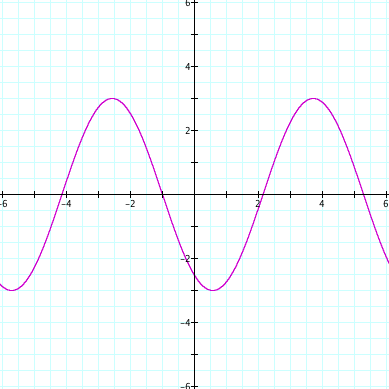
a = 2
a = 3
a = -2
a = -3
Notice how a affects the y values of the graph. Also negative values of a will invert the graph across the x-axis.
Observe the animation below has a varying from -5 to 5:
Now let's vary b but keep a and c fixed at 1:
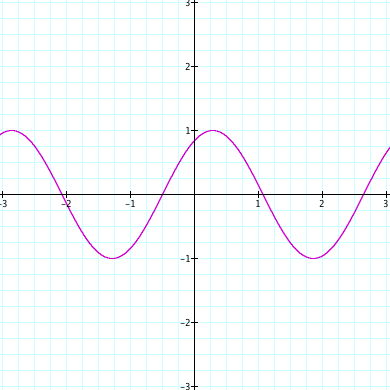
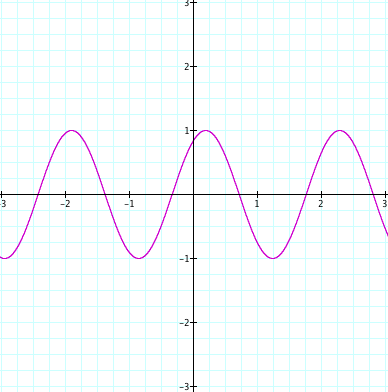
b = 2
b = 3
b = -2
b = -3
Below is the animation of b varying from -5 to 5:
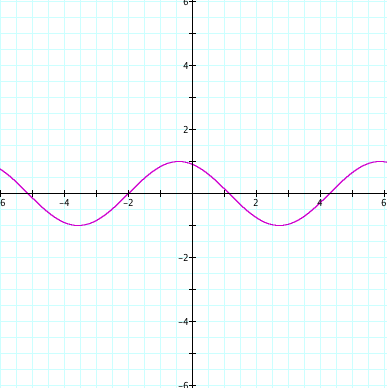
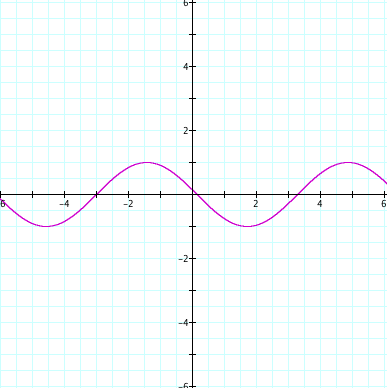
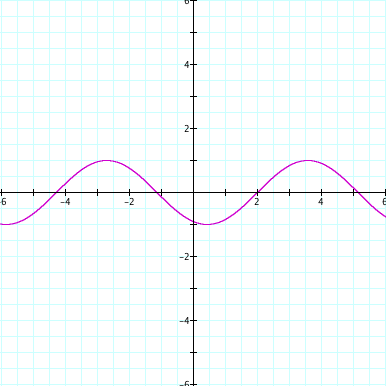
Finally lets vary c and keep a and b fixed at 1:
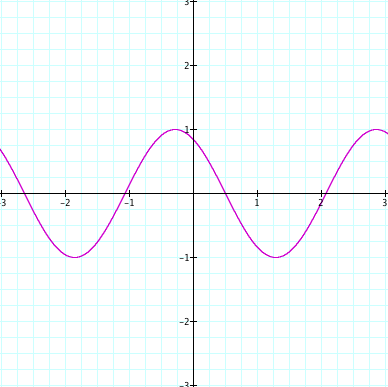
c = 2
c = 3
c = -2
c = -3
And again we have an animation of c varying from -5 to 5:
Just for funsies look at this crazy graph with a=7, b=45, c=0: